课程推荐
学校活动
雅思小作文模板套用实例 | 西安雅思学习
2019-09-05 23:04
来源:新东方网整理
作者:
常用词和套句
1) 开头概述常用套句
The graph shows (reveals, illustrates, demonstrates, depicts, describes, indicates )…
2) 开头第二句描述趋势常用套句
1)According to the graph, …
2) As (is) shown in the graph, …
3) As can be seen from the graph, …
4) It can be seen from the graph…
5) We can see from the graph…
6) It is clear / apparent from the graph…
7) as can be seen from the diagram, great changes have taken place in...
描述趋势常用套句
1) The number increased / rose suddenly / dramatically / rapidly / substantially / considerably / sharply from…to...
2) During 1990-2000, there was a sudden/rapid/dramatic/substantial/ sharp considerable rise/boom in the number of private cars from…to…
3) The ten years from 1990 to 2000 witnessed / saw a steady growth of private cars from…to…
4) The number of private cars increased/rose (fell/dropped/declined/decreased) by 20%
5) The number of private cars in 2000 was 5 times more than that in 1990.
6) The number of private cars was roughly/about/approximately doubled/ tripled between 1990 and 2000.

描述比例常用套句
1) …accounted for (/took up) 20% of all.
2) On the top of the list was…, which accounted for 70% (用于表格)
3) At the bottom of the list was…, which took up 20% only. (用于表格)
4) A was ranked first, followed by B at 20% and C at 15%
5) The figure reached the highest/lowest point in…

描述对比常用套句
1) A had almost/nearly/about/over a quarter/half/twice/one third/ as many students as/ as much money as B;
2) A had about/approximately/exactly/precisely the same number/proportion/amount of students/money as B.
3) A had something in common with B/ the difference between A and B lies in…
4) A was…., while B was….

结尾常用套句
1) we can conclude from the table that…
2) in short (=in brief),…
3) in conclusion,…
4) to conclude, it seems clear that…
5) from the table/diagram, we can see…
6) as can be seen fro the chart/table/diagram,
7) it is clear/apparent from the chart/graph/table/diagram that…

套句:
The biggest difference between the two groups (A+B) was in percentage, where A made up
1) 5% while B constituted 67%
2) The highest percentage of A, which was approximately 12%...
3) The percentage of A in… was more than twice that of B, the ratio was $% and the latter was $%.
4) A greater percentage of A than B was found in…(the former was $% and the latter was &%)
5) There was more A in…, reaching $%, compared with $% of B.
6) The percentage of A was slightly larger/smaller than that of B.
7) There was not a great deal of difference between A and B.
8) A, which used to be the…, had become less important, which declined (increased) sharply from $% in 1978 to only $% in 1998.
9) The biggest loss was to A area.
10) The biggest gains were made in A area.
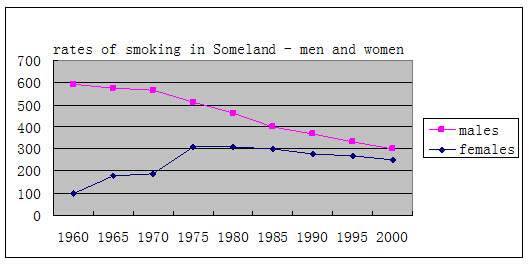
The chart shows the rates of smoking in Someland in men and women from 1960 to 2000.
雅思小作文线表1
The diagrams provide some information about the housing prices of five cities around the world from 1990 to 2000.
Summarize the information by selecting and reporting the main features and make comparisons where relevant.
雅思小作文线表2
You should spend about 20 minutes on this task.
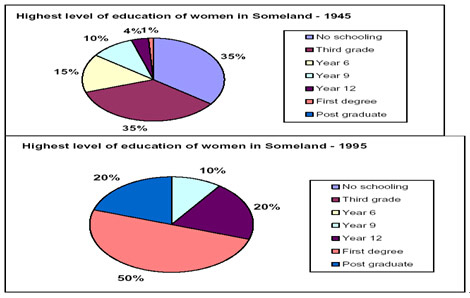
The following two pie charts show the highest level of education of women in someland in 1945 and 1995 respectively. Write a report for a university lecturer, describing the information in the 2 pie charts below. You should write at least 150 words.
雅思小作文线表3
Tables:
请将下列文章中描述的表格画出来:
A glance at four indicators of economic and social conditions in four countries, Canada; Japan, Peru and Zaire, in 1994 reflects the great differences that exist between wealthier and poorer nations.
The table shows that Japan and Canada had annual incomes of 815760 and 811100 per person, respectively. These figures were overwhelmingly greater than the corresponding figures of 8160 in Peru and 8130 in Zaire.
Health indicators, too, reflected overall levels of affluence in the four nations. Life expectancy at birth, for example, was higher among the more economically developed countries. Japan reported the highest life expectancy, 78. this was followed by Canada, 76; Peru, 51; and Zaire, 47. this suggests that richer societies are able to put more money into health care than poorer ones.
The amount of calories consumed daily per person roughly followed the same ranking. Canadians each consumed some 3326 calories per day while the Japanese took 28-f6 calories. The corresponding figures for Peru and Zaire were 1927 and 1749, respectively.
Literacy rates among adults, too, were higher in wealthier countries, no doubt a reflection of ability to invest in education. Canada and Japan both reported literacy rates of 99%, while Peru claimed 68%. Zaire, the least economically developed of the four countries, had a literacy rate of 34%.
The data appear to confirm the often cited link between national wealth and health and education standards.
表格图
The table below shows the results of a survey to find out what members of a city sports club think about the club’s activities, facilities and opening hours.
Summarize the information by selecting and reporting the main features, and make any comparisons where relevant.
Club satisfaction survey table
雅思小作文线表4
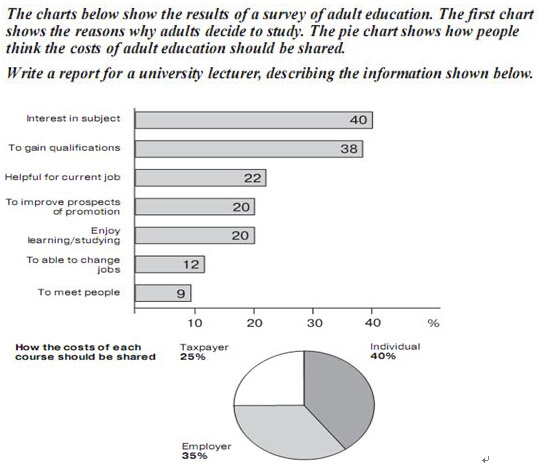
混合图
雅思小作文线表5
Flow chart:
1.常用词和套句
常用过渡词
1) firstly, the first step is to, the first stage involves, first of all, to begin with
2) secondly, the next step is to, in the next stage, in the following stage, next, then later, subsequently
3) thirdly/finally, the last step is to, in the last stage
4) at the same time, simultaneously
5) consequently
6) before this
7) after this
8) during, in the course of
9) in order to/in order not to, in order that, so as to/so as not to
如果流程比较复杂,还可以使用:
Alternatively, otherwise, in addition, at the same time, concurrently
常用套句
The following diagraph shows the structure of…
The picture illustrates…
It mainly consists of
It works as follows
It always involves the following…steps
The whole procedure can be divided into…stages
流程图
You should spend about 20 minutes on this task.
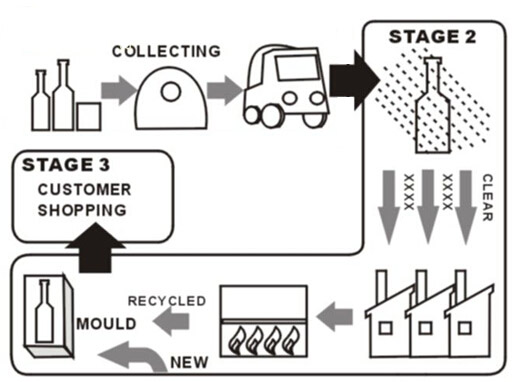
The flow chart below shows how glass bottles recycled.
Write a report for a university lecturer describing the chart below. You
should write at least 150 words.

新东方小程序
查课程、找校区、找老师
版权及免责声明
①凡本网注明"稿件来源:新东方"的所有文字、图片和音视频稿件,版权均属新东方教育科技集团(含本网和新东方网) 所有,任何媒体、网站或个人未经本网协议授权不得转载、链接、转贴或以其他任何方式复制、发表。已经本网协议授权的媒体、网站,在下载使用时必须注明"稿件来源:新东方",违者本网将依法追究法律责任。
② 本网未注明"稿件来源:新东方"的文/图等稿件均为转载稿,本网转载仅基于传递更多信息之目的,并不意味着赞同转载稿的观点或证实其内容的真实性。如其他媒体、网站或个人从本网下载使用,必须保留本网注明的"稿件来源",并自负版权等法律责任。如擅自篡改为"稿件来源:新东方",本网将依法追究法律责任。
③ 如本网转载稿涉及版权等问题,请作者见稿后在两周内速来电与新东方网联系,电话:010-60908555。